Data collection
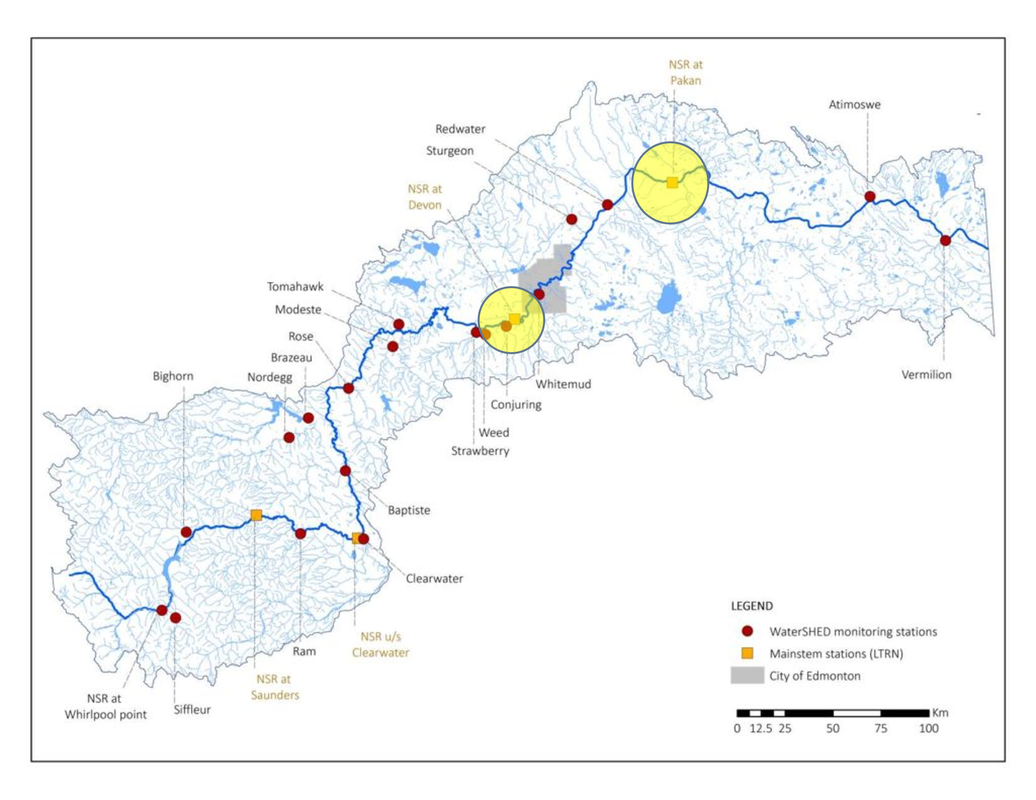
The study was conducted along the North Saskatchewan River, focusing on two long-term monitoring stations located upstream and downstream of the city of Edmonton. The upstream station, Devon Station, and the downstream station, Pakan Bridge, were selected to capture the changes in water quality as the river flows through the urban area. Water quality data from 2018 to 2022 was obtained from the Alberta Environment and Parks' (AEP) Water Quality Monitoring Data portal. The dataset included monthly measurements of various water quality parameters, such as metals, nutrients, and biological indicators.
Figure 1. Surface water quality monitoring stations in the North Saskatchewan River Watershed (Devon and Pakan Bridge Stations in yellow). Source: (Government of Alberta, 2022)
Statistical Analysis
Descriptive statistics were calculated for each parameter, including mean, standard deviation, and range. To assess the differences in water quality parameters between the upstream and downstream stations, independent t-tests (α = 0.05) were conducted for each parameter in both summer and winter seasons. The results were considered statistically significant if the p-value was less than 0.05.
Line graphs were generated for each parameter to visualize the temporal trends and seasonal variations in water quality. The graphs displayed the monthly concentration of each parameter, with the shaded area representing the summer season. Horizontal lines were included to indicate the trigger values for each parameter, as set by the regulatory agency. These trigger values serve as a guideline, and when exceeded, may indicate a need for further investigation or management actions to protect the ecosystem and public health.
Line graphs were generated for each parameter to visualize the temporal trends and seasonal variations in water quality. The graphs displayed the monthly concentration of each parameter, with the shaded area representing the summer season. Horizontal lines were included to indicate the trigger values for each parameter, as set by the regulatory agency. These trigger values serve as a guideline, and when exceeded, may indicate a need for further investigation or management actions to protect the ecosystem and public health.
