Data table
Ten primary water quality indicators were selected for the analysis: total phosphorus, total nitrate plus nitrite, E.coli, total dissolved solids, pH, dissolved oxygen, total mercury, total organic carbon, and dissolved aluminum. The data was further categorized into two seasons: summer (April to September) and winter (October to March).
Table 1. Data table of water quality parameters for three stations during the study period (2018 – 2022).

Table 2. Water quality parameters assessed in the North Saskatchewan River and its trigger values.

Exploratory graphics
Figure 2. Total phosphorus (mg/L) concentration in water samples at the three stations. Horizontal lines represent trigger values for this parameter at each station. Shaded area (light yellow) reflects the summer months.
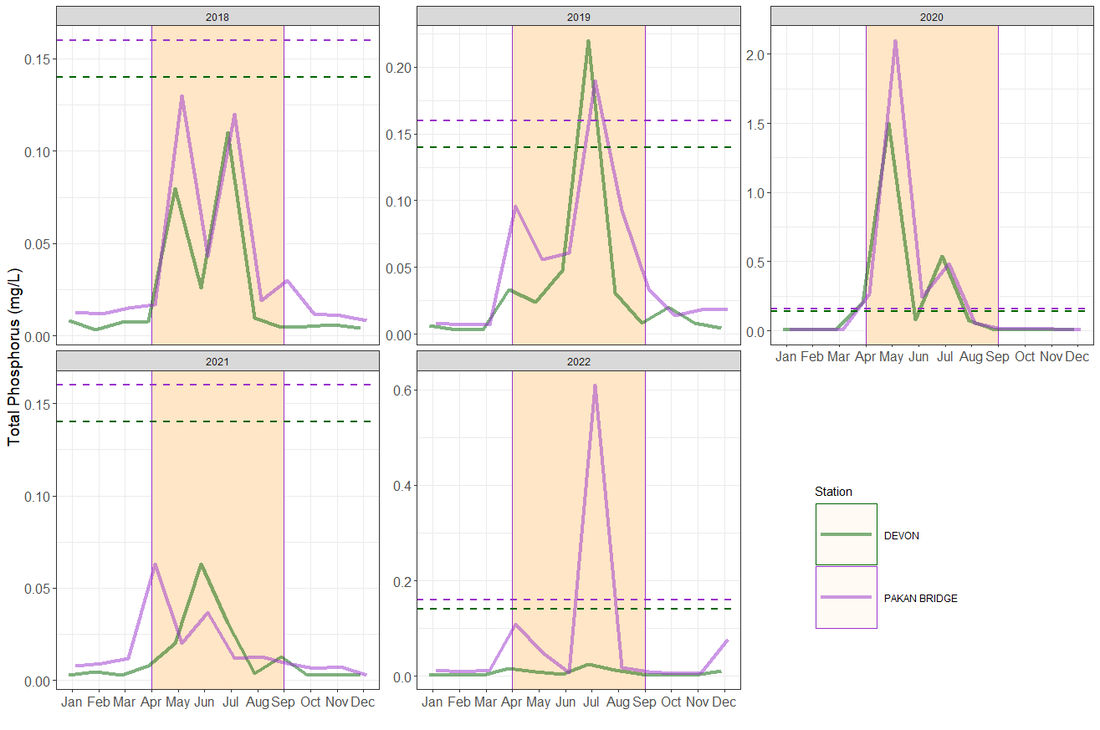
Monthly samples (2018-2022) were used to assess differences between the parameters concentrations at both stations (n=180). Data from each parameter was plotted to understand trends. Overall, concentrations varied seasonally: Total phosphorus concentrations were highest in June and July and declined significantly through August and September. In 2020, total phosphorus levels at both stations exceeded the trigger value, indicating a potential risk to water quality. In the following years, the station upstream Edmonton showed a decrease in the phosphorus concentration while this nutrient increased downstream the city. Monitoring total phosphorus is essential because excessive amounts can lead to eutrophication, promoting harmful algal blooms that can deplete oxygen levels, harm aquatic life, and pose a risk to human health.
Figure 3. Total Mercury (ng/L) concentration in water samples at the three stations. The x-axis represents the months, and the y-axis shows the mercury concentrations in ng/L. Horizontal lines represent trigger values for this parameter at each station. Shaded area (light yellow) reflects the summer months.
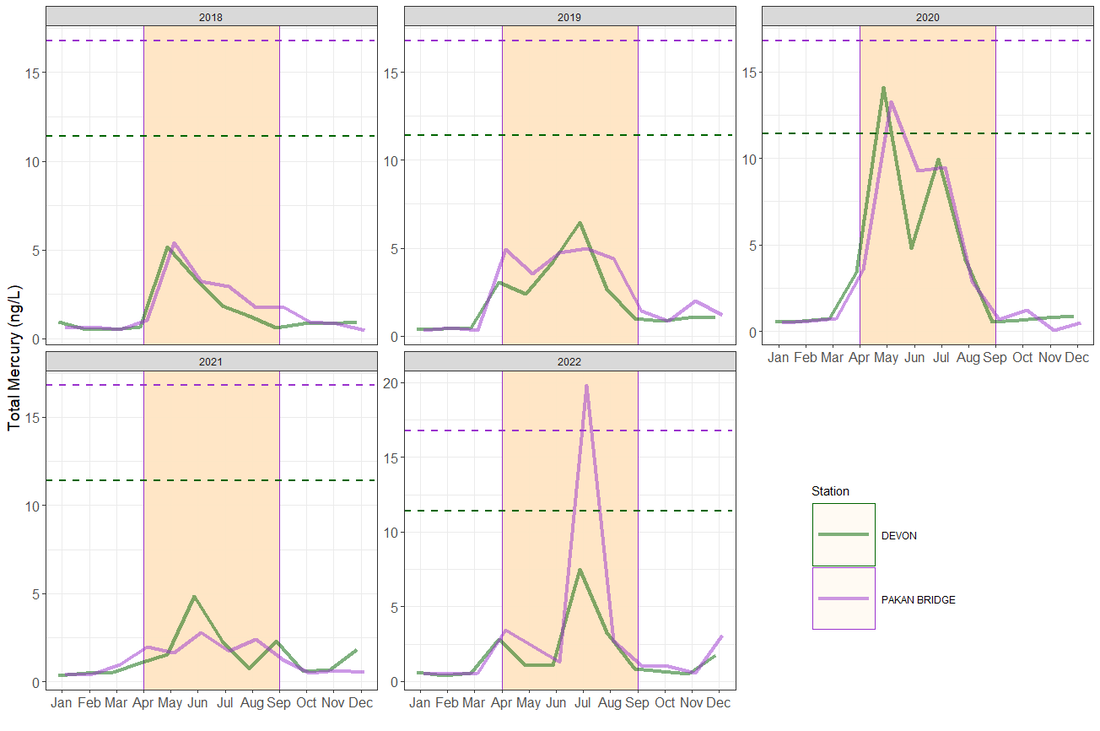
Monitoring total mercury levels in aquatic environments is crucial because elevated concentrations can have detrimental effects on both aquatic ecosystems and human health. Once in the water, mercury can be transformed into methylmercury, which bioaccumulates in organisms and biomagnifies up the food chain. Total mercury concentrations fluctuated over time at both stations, with some seasonal variation. A noticeable spike in mercury levels is observed in 2022 at the downstream station, with a value above the trigger, suggesting potential mercury contamination in the urban area that requires further investigation and possible mitigation measures to protect aquatic life and public health.
Figure 4. Total Nitrate plus Nitrite (mg/L) concentration in water samples at the three stations. The x-axis represents the months from January to December, while the y-axis shows the nitrate plus nitrite concentrations. The graph is divided into different facets for each year, ranging from 2018 to 2022. Horizontal lines represent trigger values for this parameter at each station. Shaded area (light yellow) reflects the summer months.
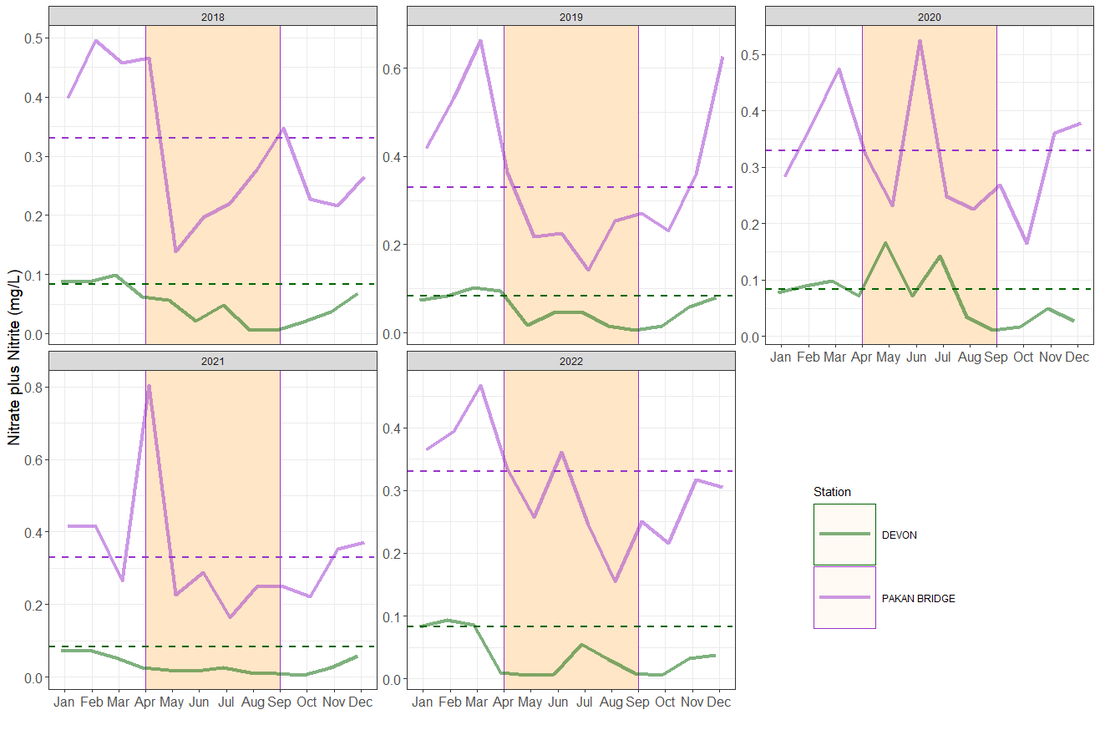
The nitrate plus nitrite values at the Devon station were consistently under the trigger values across all years. However, nitrate plus nitrite values were found to be above the trigger values during the winter season (January to April) in all years at the Pakan bridge station. These findings suggest that there may be some specific sources of these compounds that are contributing to the elevated levels during the winter season.
Figure 5. Total E. coli (No/100 mL) concentration in water samples at the three stations. The x-axis represents the months from January to December, while the y-axis shows the E.coli concentrations. The graph is divided into different facets for each year, ranging from 2018 to 2022. Two lines are displayed in each facet, representing data from two monitoring stations, one upstream (dark green line) and one downstream (dark orchid line). Horizontal lines represent trigger values for this parameter at each station. Shaded area (light yellow) reflects the summer months.
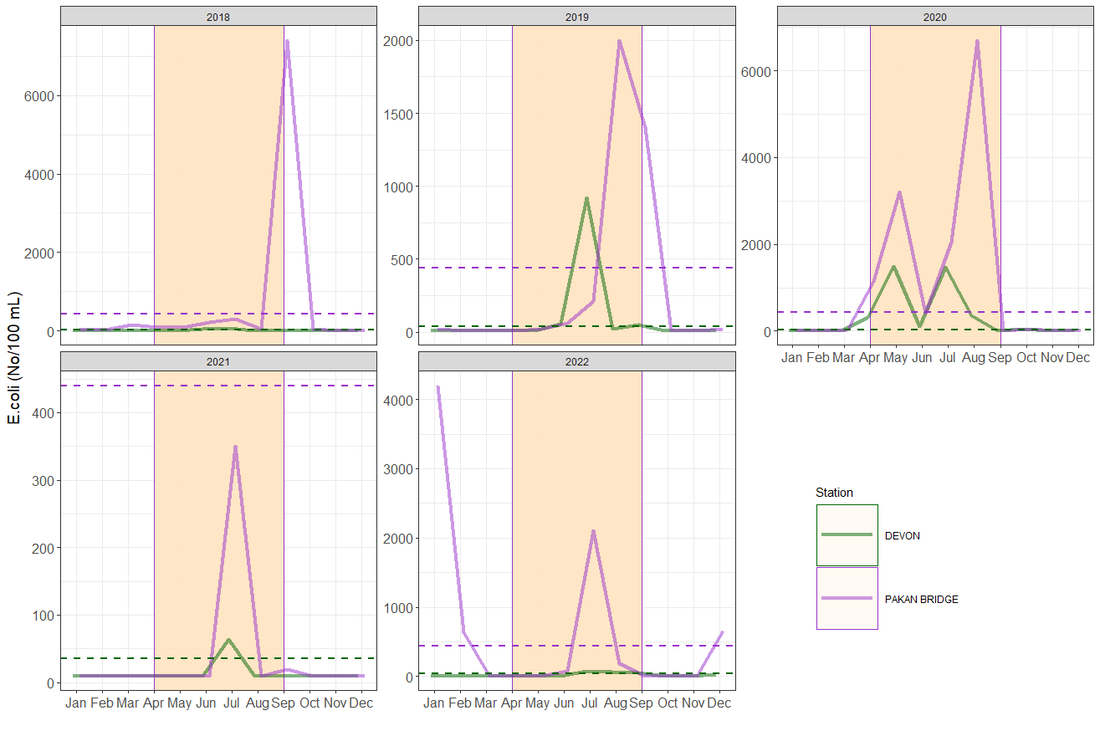
E.coli is an indicator of fecal contamination, and monitoring its levels is crucial for assessing the sanitary quality of water bodies. Elevated E.coli concentrations can signal the presence of pathogens, posing risks to human health, especially for recreational activities like swimming. Tracking E.coli levels helps in identifying contamination sources and implementing measures to improve water quality and ensure public safety. There were found higher E.coli concentrations at the downstream station (Pakan Bridge) compared to the upstream station (Devon Station) during the summer months. However, these differences appear to be less pronounced during the winter months. Furthermore, the graph shows some fluctuations in E.coli concentrations over the years, with some years having higher concentrations than others.
